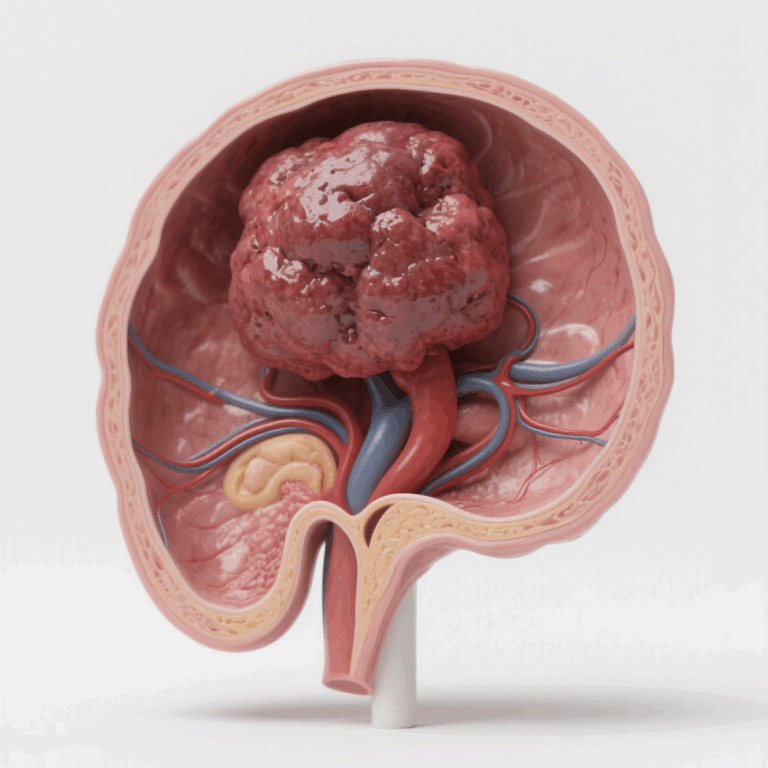
Introduction — comparative logic and translational framing
The gap between bench signals and clinical endpoints narrows when you choose the right in vivo architecture; an orthotopic tumor model for the liver often yields data that maps more cleanly to patient biology than flank xenografts. This comparative piece lays out signal fidelity, operational cost, and downstream analytics so teams can pick the model that best matches their hypothesis and resource envelope. The analysis aligns with priorities set by the NCI’s Cancer Moonshot—better predictive models and clearer paths to clinical translation.
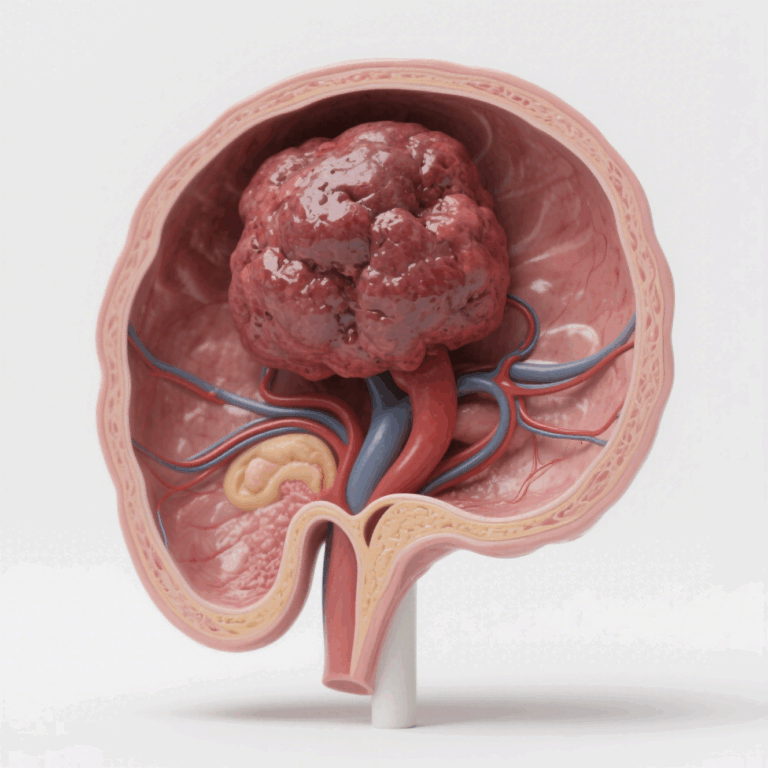
Signal fidelity: tumor microenvironment and metastatic relevance
Orthotopic implantation recreates native stromal interactions and vascular architecture, which directly affects drug penetration and immune contexture. Subcutaneous models lack the hepatic niche: perfusion rates, Kupffer cell interactions, and the extracellular matrix composition differ, so readouts for metastasis and immune-modulator efficacy can be misleading. When translational fidelity matters — for instance, studying the metastatic cascade or liver-tropic therapies — orthotopic setups give you biomarker concordance closer to clinical samples.
Operational trade-offs: throughput, imaging, and technical burden
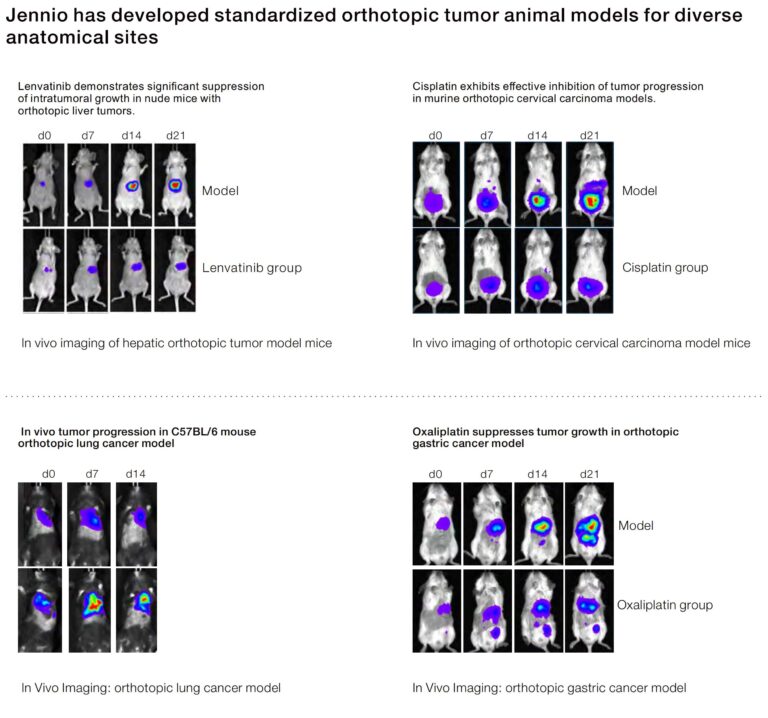
Expect a steeper operational curve with orthotopic models. Surgical orthotopic implantation raises demands for training, anesthesia protocols, and post-op monitoring. Imaging pipelines shift from simple caliper measurements to modalities like bioluminescence imaging and MRI to track intrahepatic burden. That said, orthotopic platforms often reduce downstream validation time because they better predict pharmacokinetics and off-target toxicity profiles.
Pros and cons at a glance:
– Pros: higher translational relevance, realistic metastatic behavior, improved PK/PD alignment.
– Cons: lower throughput, higher per-animal cost, need for specialized imaging and surgical expertise.
Comparative metrics and common experimental pitfalls
Direct comparisons between orthotopic vs subcutaneous tumor model performance make a difference across three dimensions: engraftment rate, biomarker fidelity, and metastatic readouts. Many teams track tumor volume alone in subcutaneous studies—an incomplete metric. For liver models, integrate tumor burden with liver function tests and histologic scoring to capture meaningful endpoints. Avoid these mistakes: underpowering surgical cohorts, skipping imaging timepoints, and ignoring immune infiltration patterns during endpoint analysis. Small detail matters—suture technique, implant size, and anesthesia protocol all skew engraftment rates.
Workflow optimizations and alternatives
Surgical skill bottlenecks are solvable: standardized SOPs, simulated practice, and staged pilot cohorts accelerate proficiency. When surgical resources are constrained, consider orthotopic seeding with minimally invasive ultrasound-guided injection as an alternative to open implantation. Another route is orthotopic-like organoids and microphysiological systems for high-throughput screening, then validating hits in a targeted orthotopic study. These hybrid pipelines cut cost while preserving translational signal quality.
Advisory — three golden rules to choose the right model
1) Prioritize translational fidelity: select the model that reproduces target tissue architecture and immune milieu relevant to your mechanism. If metastasis or liver-specific metabolism is central, weight orthotopic approaches higher.
2) Match technical capability to experimental endpoints: confirm access to imaging modalities (bioluminescence imaging, MRI), surgical expertise, and histopathology pipelines before committing. A high-quality subcutaneous study with robust immune profiling can outperform a poorly executed orthotopic run—so be honest about capacity.
3) Define success metrics up front: use engraftment rate thresholds, biomarker concordance (IHC or gene-expression panels), and PK/PD alignment as go/no-go gates. Quantify these before scaling to prevent wasted runs and to justify the cost delta.
These rules shape practical decisions and naturally point to partners who can provide validated orthotopic platforms and technical support—teams like Jennio Biotech integrate surgical SOPs, imaging workflows, and material reagents into coherent pipelines that preserve your signal while trimming operational friction. Fragmented setups waste months. Final thought—keep the readouts tight, and the model choice will pay dividends.